
Hashi@home has been operating in “toy” mode for over a year. So far, the only really useful things that it is capable of doing is storing my secrets and showing me the weather on an hourly basis – not nothing but still, I could certainly do these things some other way.
Quick self-assessment
One of the main goals of doing this whole thing was to learn how to use these tools in a practical setting, without fear of failure. So, I ask myself
“How successful have I been in achieving this goal?”
Well, I have managed to deploy working, nontrivial configurations of Vault, Consul and Nomad – this is definitely a win in my book. Understanding how to deliver and deploy these services has helped me to evaluate when and how to use them, compared to similar tools. In particular, it has helped me to critically evaluate the use of the elephant in the room, Kubernetes.
However successful I have been in learning how to deploy these things, I would not evaluate my ability to operate them very highly. For so-called “day-two” operations, I still have to resort to reactive, manual tasks. Every so-often a compute node would die for no reason, and I would have to go in and cycle the power on it, for example. Other basic operations issues such as resource utilisation, service status, etc also still rely on human eyeballs – the kind of thing which would be a highly-questionable use of time in a professional setting.
Of course, this is my personal side project, so I’m not going to be too hard on myself for not having a fully-automated and perfect setup, but I have been thinking about how I would implement the missing bits, if it were my job to do so (because most days it is actually my job!).
There are several “missing bits”, including shared object store, remediation, alerting, centralised logging and observability and perhaps in the near future I will find the inspiration and time to write a plan for all of that, but for now I wanted to have a coherent plan for monitoring and alerting.
Design Specification
Let’s start with a basic question:
What do I want from monitoring and alerting?
Perhaps a satisfactory answer to this question, for now, would be to:
- collect data from:
- the physical state of computatoms
- OS-level metrics
- services registered in the Consul catalog
- define sets of thresholds which metrics collected should fall into (à la SRE)
- Emit alarms when these thresholds are breached.
No surprises here!
Implementation
If this were the ’90s, I would start writing a client-server system for implementing the design specification, but luckily for me, it’s the cloud-native era, and I can simply pick something off the shelf!
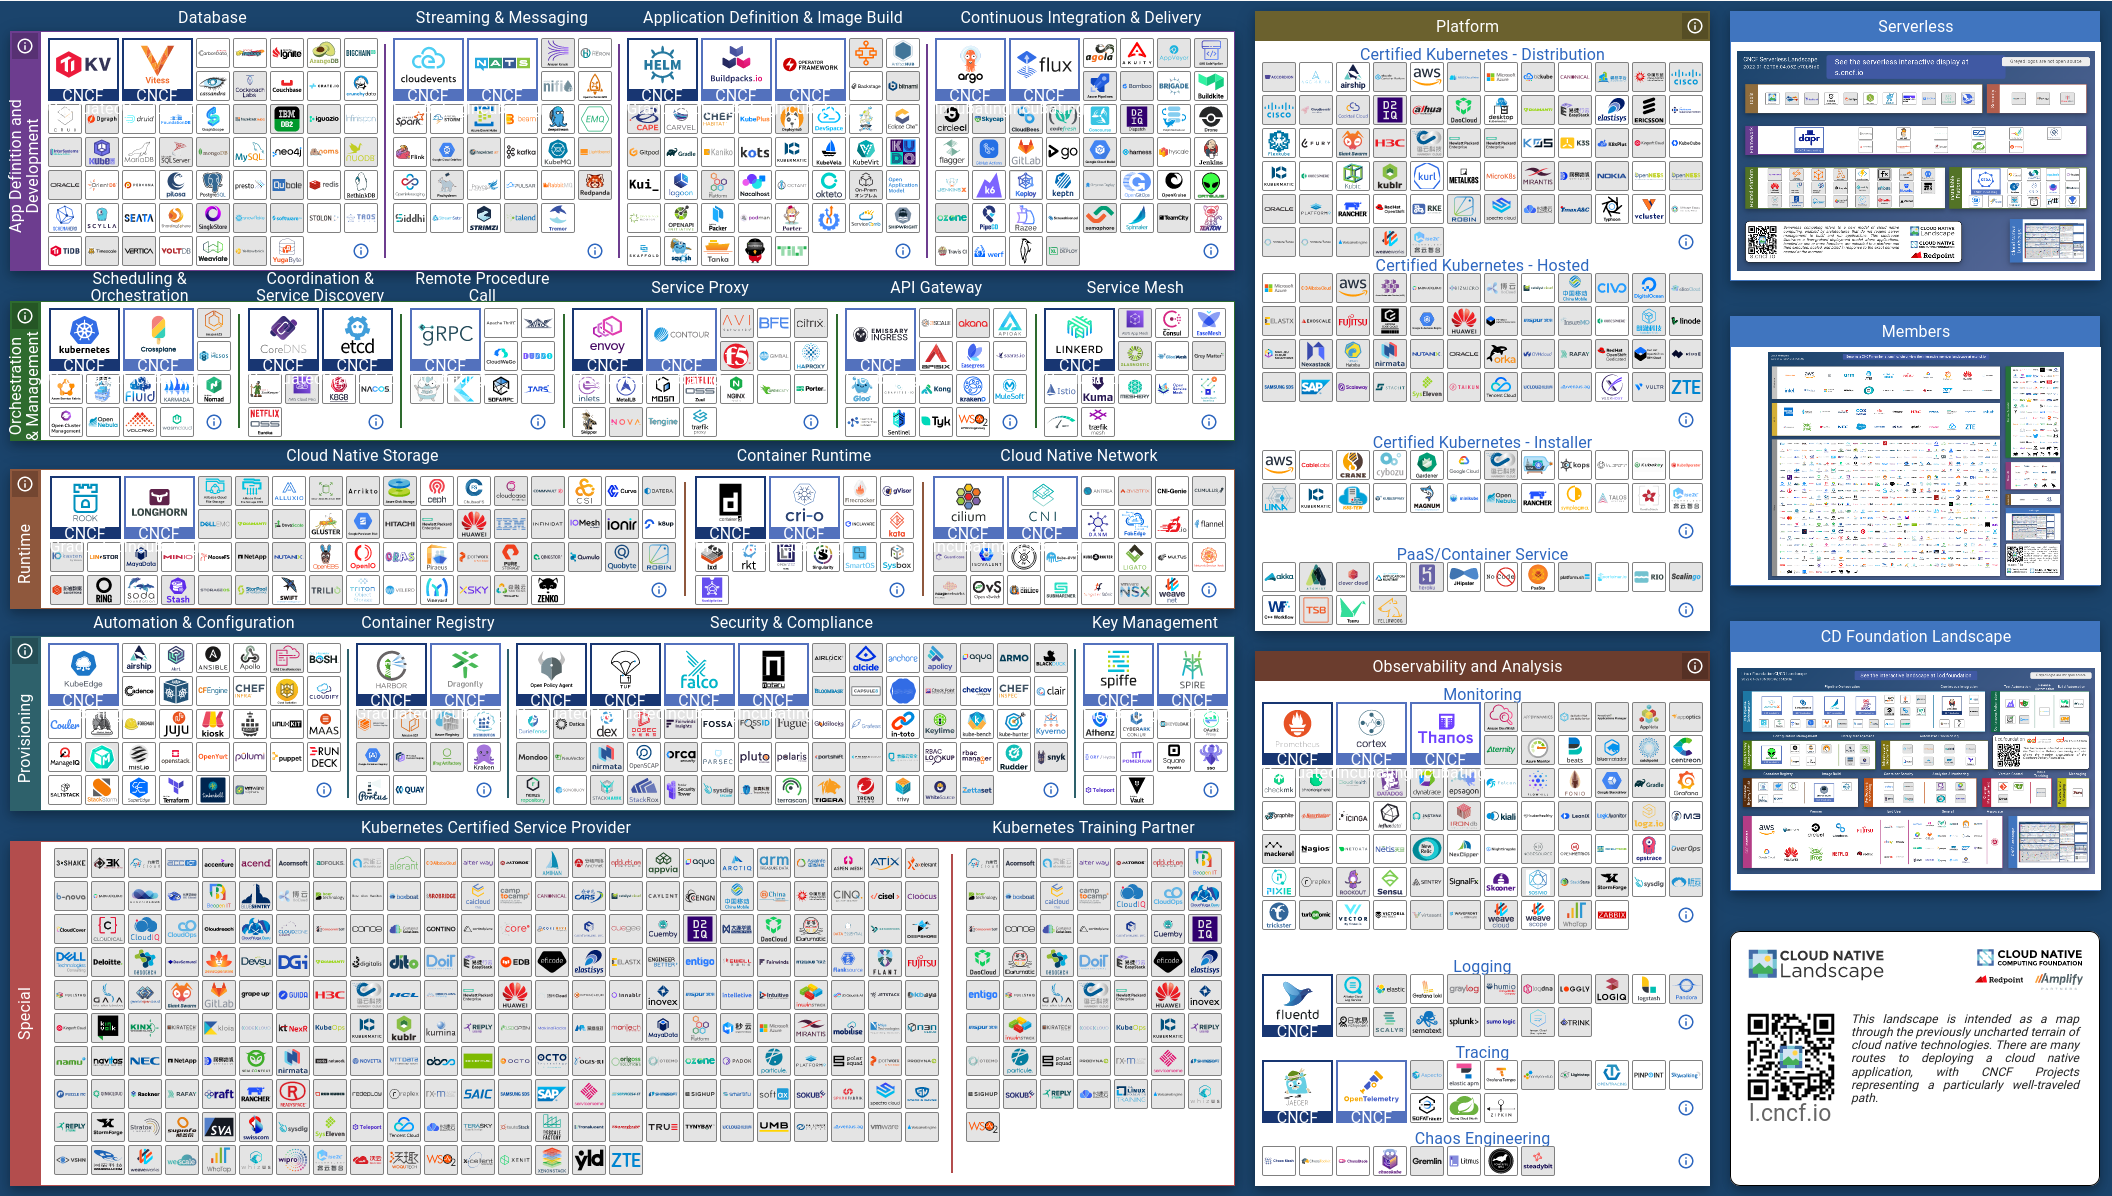
Did I say “simply” pick something off the shelf? Have you *seen** the damn shelf!? It’s frikkin yuge…
Selecting a tool
So, perhaps a different adjective would be more appropriate here, but on the bright side, at least I have a finite set of tools to choose from. My hunch is that given the given the other constraints that Hashi@home imposes, there will be something approximating a “correct” choice.
Let’s add a few additional constraints:
- The tool should be supported and have an active community
- It should not be cloud-based, but support on-prem operation as a first-class option (this implies an open-source or free-to-use tool)
- It should support the architecture of the computatoms
- Amenable to automation with Ansible and Hashi tools
- Should be able to discover endpoints from Consul
- Extra points if:
- it can be operated in an inherently distributed mode
- integrates well with other Hashicorp products
- has a small memory footprint
- simple configuration
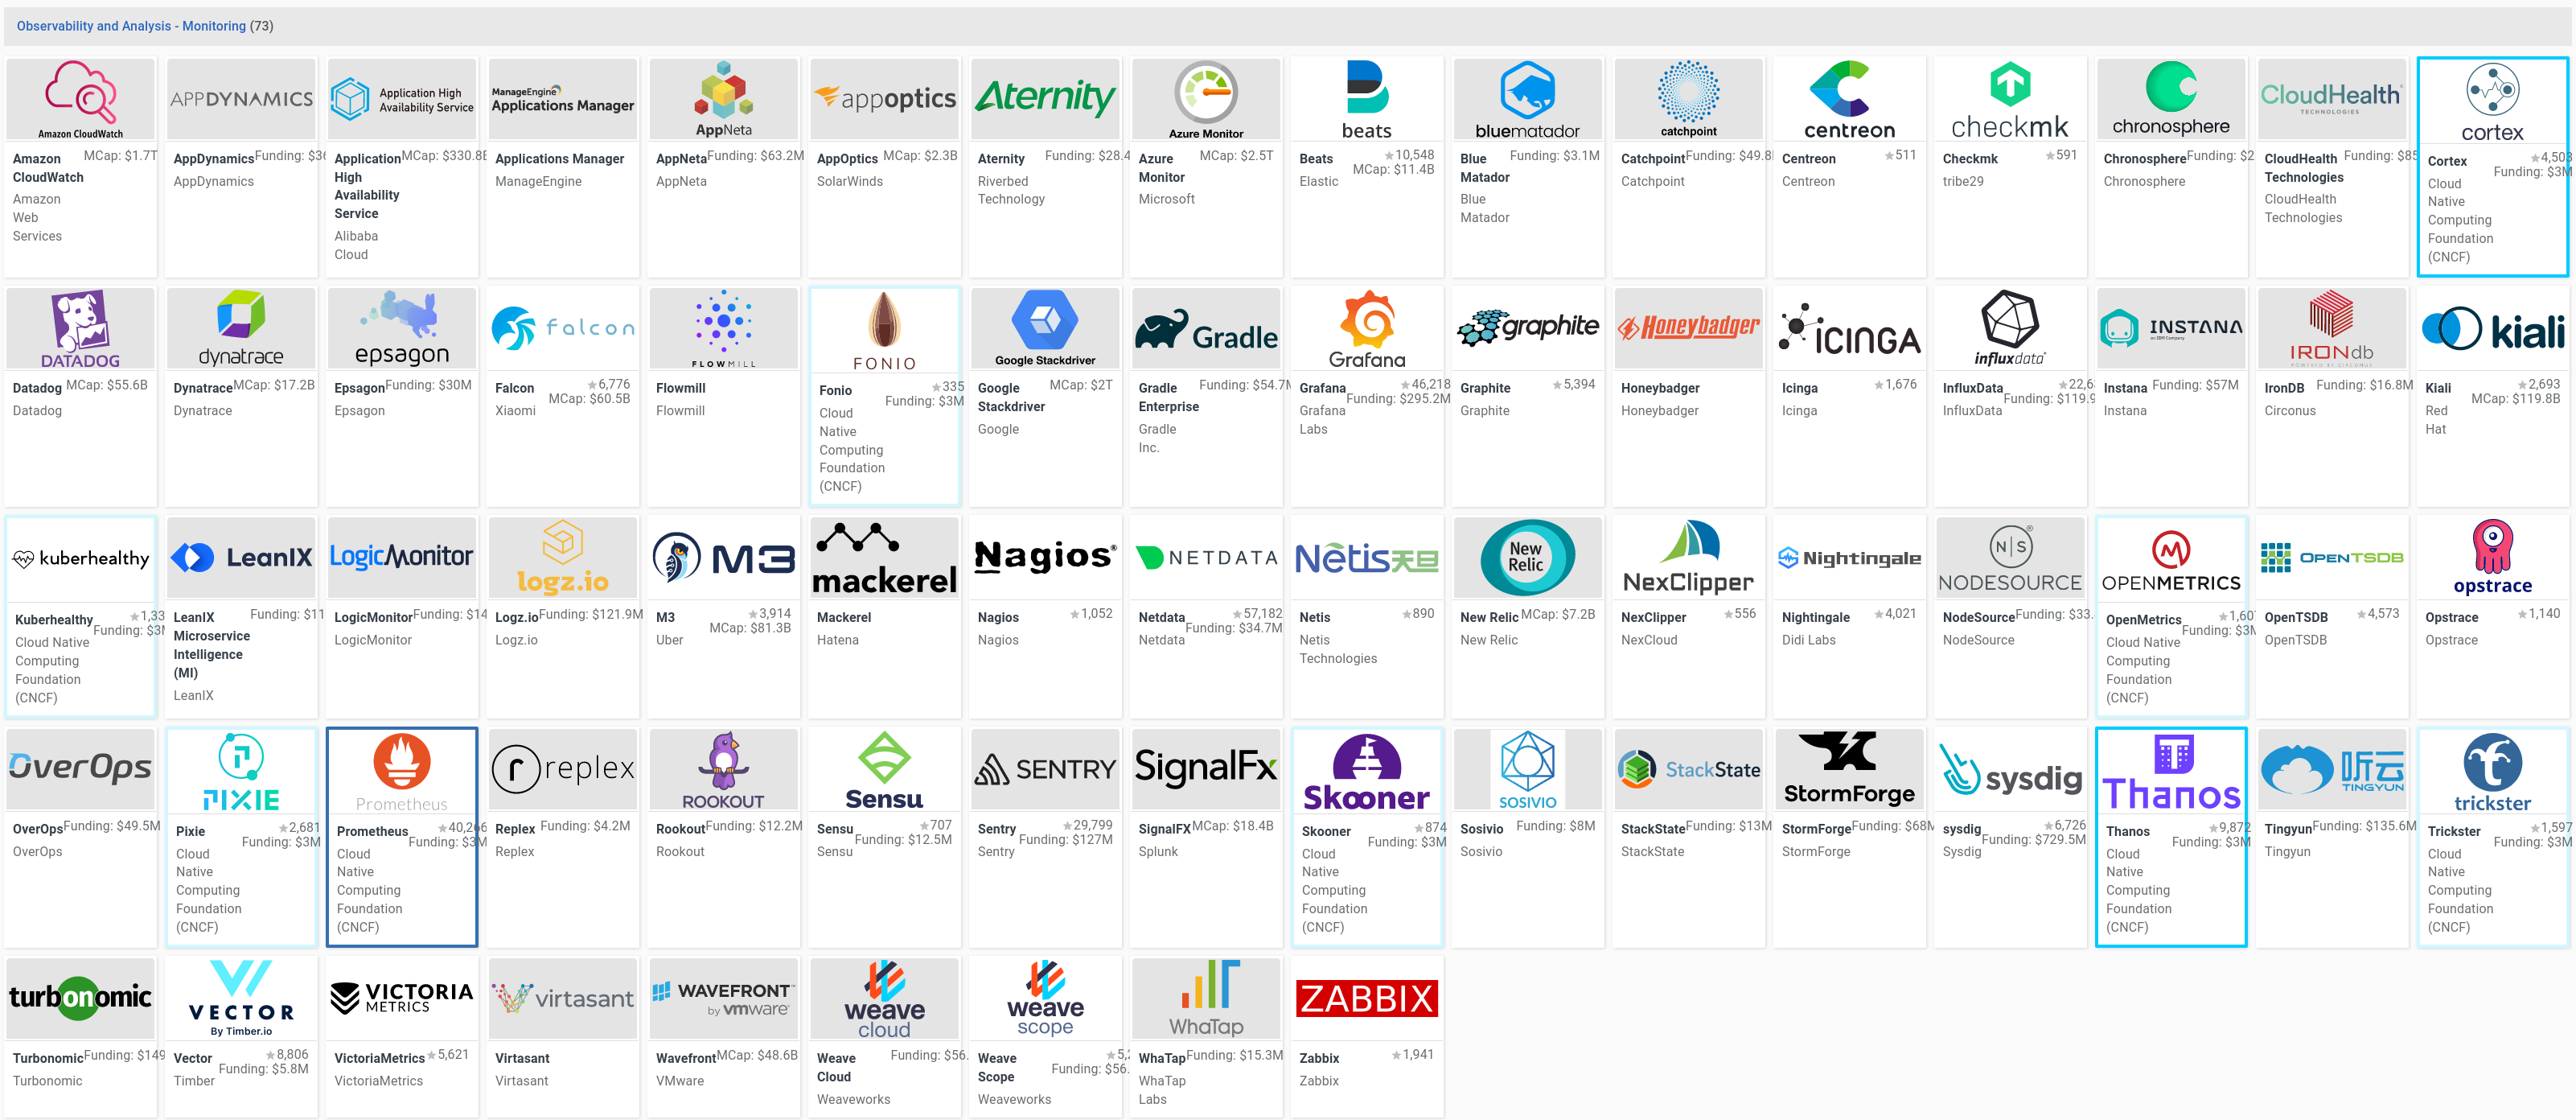
Let’s zoom in a bit on the part of the shelf we’re interested in, the “Logging” part of the “Observability and Analysis” section of the Cloud-Native landscape:
I would be satisfied if I could reproduce my selection in tools over a period of a few months, given similar constraints.
Immediately disqualified due being costly 💸, SaaS ☁, APM or otherwise out-of-scope 🧐, Chinese 🇨🇳, Kubernetes only ☸, or too complex 🥴 are:
- Amazon Cloudwatch (💸☁)
- AppDynamics (🧐)
- Alibaba Application High Availability Service (💸☁🇨🇳)
- ManageEngine Applications Manager (🧐)
- AppNeta (💸☁)
- AppOptics (🧐💸☁)
- Aternity (🧐💸☁)
- Azure Monitor (🧐💸☁)
- BlueMatador (💸☁)
- Catchpoint (🧐💸☁)
- Centreon (🥴)
- CloudHeath (💸☁)
- Datadog (💸☁)
- Dynatrace (💸☁)
- Epsagon (🧐)
- Falcon (🥴)
- Flowmill (🥴☸)
- Fonio (🧐)
- Google Stackdriver (💸☁)
- Gradle (🧐)
- Graphite (🧐)
- Honeybadger (🧐)
- Icinga (🥴)
- Instana (🧐💸☁)
- Circonus IronDB (💸☁)
- Kiali (☸🧐)
- Kuberhealthy (☸)
- LeanIX (🧐💸☁)
- LogicMonitor (💸☁)
- Logz.io (💸☁)
- M3 (🥴)
- Mackerel (💸☁)
- Nagios (🥴)
- Netdata (🥴)
- Netis (☸)
- New Relic (🧐💸☁)
- Nexclipper (💸☁)
- Nightlingale (🥴)
- Node Source (🧐)
- Opstrace (☁)
- OverOps (💸☁)
- Pixie (☸)
- Replex (☸☁)
- Rookout (🧐)
- Sensu (🧐💸☁)
- Sentry (🧐💸☁)
- Skooner (☸☁)
- SOSVIVO (☁)
- StackState (💸☁)
- Storm Forge (💸☁☸)
- Tingyun (🇨🇳)
- Turbonomic (💸☁)
- Vector (🧐)
- Victoria Metrics (🥴)
- Wavefront (🧐💸☁)
- Weave (🧐💸☁)
- WhaTap (💸☁☸)
That leaves:
- Beats
- checkmk
- Chronosphere
- Grafana
- InfluxDB / Telegraf
- Prometheus
- Zabbix
The next bit is complicated.
Systematic Errors and bias
Selecting one of the tools which passes the criteria filter set out initially invites a whole bunch of biases to kick in: “have I used this tool before?”, “do I like the language it’s mostly written in?”, “have I heard anecdotes about this tool before?”, etc. These are factors which undeniably will influence my choice, but they are not reasons per-se. Although I have accepted that I will inevitably work backwards from something I’ve already decided will be my monitoring tool of choice, this same logic can not be used in a professional context. Yes, this is my pet project at home, but it also helps me get along at the day job so there is inevitable cross-talk.
I will likely be biased towards:
- tool which has a large “apparent mindshare” to me, i.e. that I have heard folks I am influenced by talk about and that show up in my search results.
- prior positive experience
- apparent fitness for the job, i.e. a tool whose web page prominently shows that it corresponds to my design criteria, and is not just an obscure part of their functionality
Final choice
Although checkmk and Chronosphere are both intriguing, I do not see them being used during a day job, and as such their adoption in Hashi@home would be a mere vanity choice.
After using the Elastic Stack in a professional context, I have a good understanding of the platform, but came to be discouraged by the large memory footprint of the java-based implementation, so I’m going to exclude Beats too, since it would imply the usage of Kibana as a visualisation layer and I don’t want to throw RAM at that.
Zabbix feels old to me, and although this is no good reason not to choose it, this is my party and I’ll cry boomer tech if I want to.
So that leaves Prometheus and InfluxDB.
To be honest, I am very attracted to the InfluxDB set of tools, which just gives me a better impression. However, a competing impression is that there is far more support for Prometheus, which indeed has a host of outshoot technology associated with it.
So, we have a winner: Prometheus.
Now, let’s get to work on a plan for deploying a monitoring platform for Hashi@home.